
When teaching is delivered remotely, both students and teachers can find it difficult to keep track of students’ academic progress. Students may wonder whether they have understood the subject matter correctly and question their ability to estimate the workload required to achieve the expected learning outcomes. They may wonder whether they are making progress as effectively as others in the group. If coursework includes a great deal of independent study, it can be challenging for teachers to make sure everyone is still on track. Are there students behind the screen who need more guidance and support?
This tip helps you overcome these worries with the help of learning analytics.
What does learning analytics mean?
Learning analytic is the measurement, collection, analysis and reporting of data about learners and their contexts, for purposes of understanding and optimising learning and the environments in which it occurs. Learning analytics can help students plan their studies and maintain their motivation. Teachers can utilise learning analytics to provide timely support to students who need it.
There are digital tools available for measuring and analysing student activities, but it is important that the student activities are designed to generate log data and digital traces, such as completed coursework and assignments. Teachers should also set up course milestones where they pause to analyse and reflect on the generated data. This means that learning analytics must be integrated into the teaching and learning processes already at the course design stage. Teachers must consider the types of data that can be collected about students’ progress and learning. What does the collected data tell us about students’ progress? How will the collected data affect course activities?
When planning your course, consider at least the following questions:
- Course milestones and intermediate goals: Intermediate goals offer students the opportunity to reflect on their learning and make necessary adjustments. Mid-course tests, quizzes, written assignments and class discussions generate data that helps the teacher provide timely support and help students understand content and resolve confusion. When a large course is broken down into milestones, it is easier to estimate and manage the required workload.
- Estimating the course workload: When planning their courses, teachers should consider the types of data they need to track students’ progress and how much time it will take to collect and analyse this data. To generate data, students must leave behind digital traces. Teachers must consider how different types of assignments will add to the workload of both the students and the teacher. As analysing the data may take a great deal of time, it may be best to identify the areas where learning analytics will bring most benefits. You can favour automatically marked tests and automatic/group feedback or use the tools available in the virtual learning environment to illustrate students’ progress.
- Feedback: What does the available data tell us about students’ learning and progress? Is log data enough to track progress? What does data reveal to students? Is a score or a grade enough to show students how well they are doing, or is also necessary to provide verbal feedback? Is it even possible to provide individual feedback to a large group of students? Could peer feedback or model answers be offered instead?
Analytics tools in Moodle:
- Completion tracking: Completion tracking enables you to track students’ progress through a sequence of learning materials towards the completion of your course. You can determine whether students will progress along a predefined learning path or work at their own pace by marking the activities as complete. You can ensure that students view certain resources or complete certain activities before moving on to others. Of all the analytical tools available in Moodle, Completion tracking is the most helpful one for students as it enables them to clearly see their progress towards course completion. The Completion progress block also gives teachers a clearer view of students’ progress than log data.
![]()
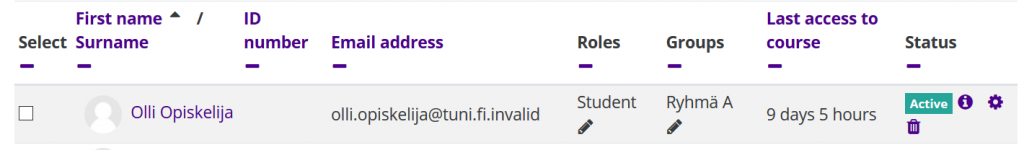
- Participants: The list of participants in Moodle shows the last time when each student visited the Moodle page. You can easily spot students who have been inactive for a long time. Click on a student’s name to access more detailed information about his or her activities in the Moodle area.
- Reports: Moodle’s log data (Administration block > More… > Reports) shows you all student activity and clicks. You can filter the view to only display, for example, messages or certain activities.
- Gradebook: The Moodle Gradebook automatically aggregates the scores and feedback from graded assignments and activities from your Moodle course. You can also add manual grades to the gradebook.
- H5P: Moodle’s H5P plugin includes a variety of tools for creating interactive activities. Interactive video assignments give students real-time feedback on their learning. Assignments that include game-like elements work well as mid-course assignments. Still, H5P mainly supports students’ learning and displays limited data to teachers compared to, for example, the Moodle quiz plugin.
Read more