
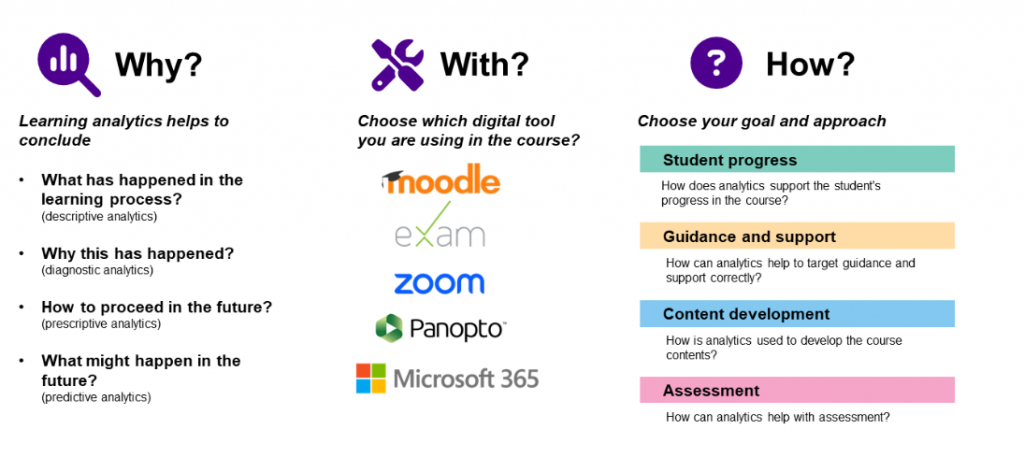
Learning analytics means the use of data generated during the learning process to support student guidance, assessment and content development. The data can be generated by the student’s activities or log data generated by learning environments and digital tools. Using learning analytics does not require specific technical skills, but you can get started simply with a small change of settings in Moodle or by using ready-made analytics charts in the tools. Many of the digital tools available provide easy tools to visualise student progress and the need for support and guidance, and to gain valuable insights for improving teaching.
Thin tip presents different ways of using learning analytics with existing digital tools. The learning analytics use cases on the page are categorised according to the learning environment or digital tool in use.
Moodle
| Use case | Tool | Links |
| Student progress | ||
| Show students their progress in the course and in different tasks | Completion tracking | Instructions |
| Set up an automatic feedback or message to be sent to the student when a certain target is reached or a certain deadline is approaching | Reengagement | Instructions |
| Build a learning path to the course area | Completion tracking | Instructions |
| Show students their assessment of the different tasks | Grades | Instructions |
| Guidance and support | ||
| Review individual student progress and identify support needs | Reports/course participation | Instructions |
| Review the progress of the whole group on the course and identify students who need guidance | Completion tracking | Instructions |
| Content development | ||
| Review students’ activity in the different tools and resources | Reports/activity completion | Instructions |
| Assessment | ||
| Examine students’ grades in different tasks. | Grades | Instructions |
| View students’ grades for a particular assignment | Assignment | Instructions |
| View students’ grades in a particular exam | Quiz | Instructions |
M365 in teaching and learning
| Use case | Tool | Links |
| Guidance and support | ||
| See an overview of student activity in the Teams Education group (course area), e.g. – Students’ visits to the group – Statistics on assignments returned by students – The number of messages and message replies from students in the group |
Teams Education group: Insights | Instructions |
| View student attendance at Teams meetings | Teams: Calendar / Meeting / Attendees | Instructions |
| View the results of activities (e.g. surveys and chat messages) used in Teams meetings afterwards | Teams: Calendar / Meeting / Select activity | Instructions |
| Collect attendance and students’ feelings & updates | Reflect | Instructions |
| View an overview of the task cards and statistics in Planner | Planner: Charts | Instructions |
| Content development | ||
| Review the activity of all your Teams groups, for example to remove unnecessary groups | Teams: Analytics | Instructions |
| View viewing statistics for Sway presentations | Sway: Analytics | Instructions |
| View Stream video viewing rates | Stream: Analytics | Instructions |
| Assessment | ||
| Grade assignments returned by students, give feedback and review the statistics in the Teams Education group (course area) | Teams Education group: Assignments | Instructions |
| Evaluate responses to a Forms form or grade quiz (e.g. exam or other assignment) and review the statistics | Forms: Responses | Instructions |
EXAM
| Use case | Tool | Links |
| Student progress | ||
| Tell students where to find assessed exams and feedback from exams | Exam / Assessment | Instructions |
| Content development | ||
| Review the exam summary and examine e.g. Is the duration of the exam correct in relation to the tasks in the exam? Has the verbal feedback from the exam performance assessments been read? Are there too many difficult or easy questions in the exam? |
Exam / Exam summary | Instructions |
| Assessment | ||
| Assess exam submissions and give verbal feedback to students | Exam / Assessment | Instruction |
Video services
| Use case | Tool | Links |
| Student progress | ||
| View student-specific viewing statistics of recordings | Panopto / Analytics | Instructions |
| Content development | ||
| View the viewing statistics of the recordings and the student’s activity during the viewing (comments, notes) | Panopto / Analytics | Instructions |
Guidelines
- Interpretation: Learning analytics helps you to get insight about the learning process, but it rarely tells the whole truth. Take into account other ways of demonstrating learning and activity that are not recorded in learning analytics. Students also need guidance in interpreting the data displayed to them.
- Implications: Consider the potential impact of analytics on motivation. Include positive information and messages, as falling behind others and highlighting failures can also discourage or undermine motivation.
- Openness and transparency: Be sure to tell students what information about their activities will be recorded and collected, and who will use it and for what purpose. Explain the reasons for collecting the data (legal/consent).
- Retention and deletion. According to the regulations on the assessment of studies lock, data related to the evaluation must be kept for a certain period of time. However, please ensure that the data are properly deleted after that period.
Remember also Digital Tools for Learning -onion model, where you can find all the tools available and instruction for using them.