
TAMK graduates’ employment situation at the end of studies
| Employed, % of respondents | 2017 | 2018 | 2019 |
|---|---|---|---|
| Education | 50 % | 55 % | 67 % |
| Business, administration and law | 68 % | 79 % | 75 % |
| Agriculture and forestry | 55 % | 73 % | 82 % |
| Services | 83 % | 73 % | 87 % |
| Arts and humanities | 54 % | 50 % | 64 % |
| Engineering, manufacturing and construction | 78 % | 81 % | 82 % |
| Health and welfare | 74 % | 75 % | 75 % |
| Information and communication technologies (ICT) | 67 % | 69 % | 76 % |
| Total | 72 % | 76 % | 77 % |
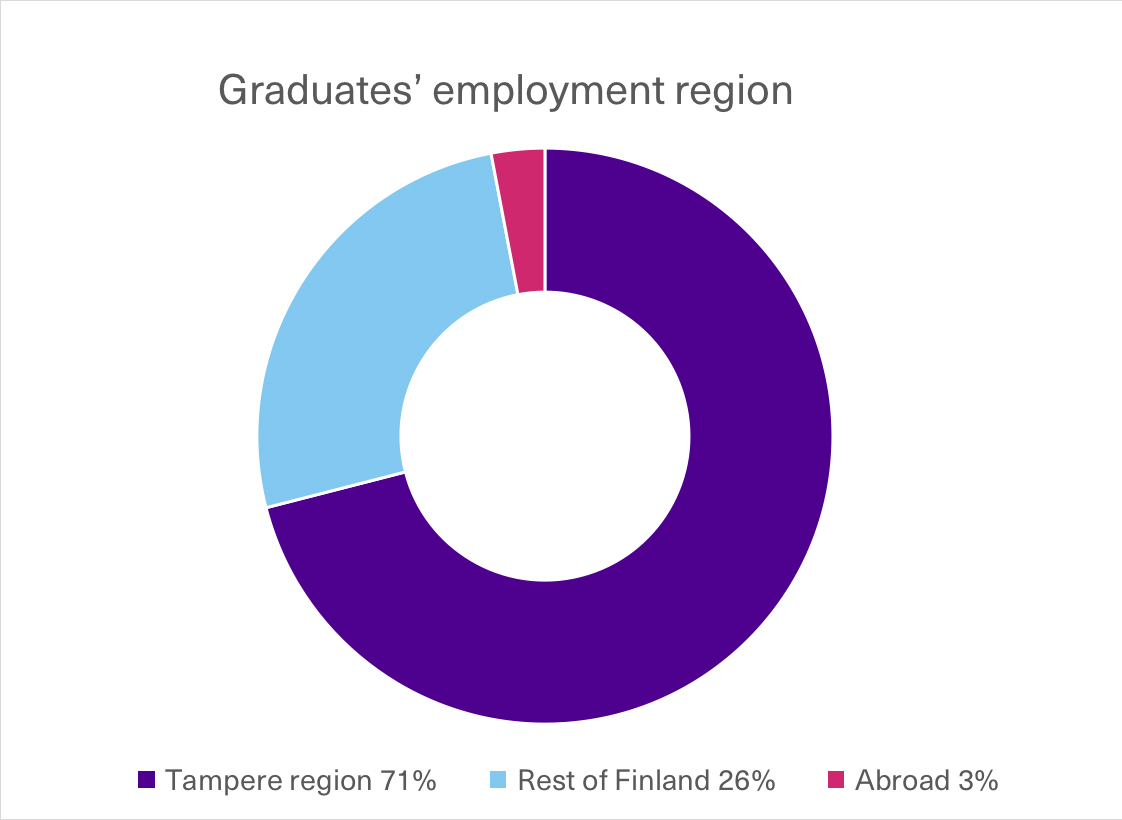
TAMK graduates’ employment region
| Employment region |
2017 | 2018 | 2019 |
|---|---|---|---|
| Rest of Finland | 23 % | 23 % | 26 % |
| Tampere region | 74 % | 74 % | 71 % |
| Abroad | 3 % | 2 % | 3 % |
Graduates’ employment as entrepreneurs
| Graduates (bachelor/master) % | 2017 | 2018 | 2019 |
|---|---|---|---|
| Starting/continuing as an entrepreneur | 4,7 % | 4,2 % | 4,6 % |
Source: Feedback survey for UAS students at graduation phase